Everyone says keep ACoS under 25%. On my wood-finishing catalog, break-even ACoS runs 41-50%, and for a thin-margin commodity, 25% can lose money.
Two years into selling wood-finishing products on Amazon, I built my own Selling Partner API integration — because ACoS alone wasn't telling me what I needed to know. ACoS is ad spend divided by ad-attributed revenue. That's all it is. It can't see what you paid for the product, what Amazon charges to fulfill and refer it, what happens when someone returns it, or your organic sales and what a customer is worth over time. So the number everyone optimizes was quietly making my advertising decisions for me — and it was wrong about half the time.
The 25% rule was wrong for my products — by being too cautious
"Keep your ACoS under 25%." You've heard it a hundred times. So I did the boring thing and calculated break-even ACoS — the ACoS at which a sale nets exactly zero after COGS, FBA, and referral fees — for each product in my own catalog:
- Soft Paste Furniture Oil & Wax — $17.99, about $7.44 of margin per unit → break-even ACoS ~41%
- Refined Walnut Oil — $17.99, about $8.04 margin → ~45%
- HardWax Oil — $28.95, about $14.60 margin → ~50%
Not one of them is 25%. Had I followed the rule, I'd have been cutting campaigns running 35% ACoS that were still netting me over a dollar a unit. The benchmark wasn't protecting me — it was leaving growth on the table. It lied by being too conservative for my margins.
And it lies the other way, too
Now flip it. Take a thin-margin commodity that sells for $19.99 with $8 of landed cost. After FBA, the referral fee, and a few returns, a 25% ACoS that looks perfectly healthy can leave you with nothing — or underwater. I don't sell commodities, but plenty of sellers do, and for them the discipline is the opposite of mine: relentless efficiency, because there's no fat margin to absorb a loose bid. The catch is you still have to keep testing new targets — Amazon's algorithm surfaces winners you'd never think to bid on yourself, so "efficient" can't mean "frozen."
Same number — 25% — and the right call is "scale it" for one seller and "kill it" for another. There is no universal good ACoS. A benchmark borrowed from someone else's business can't run yours.
The number I actually steer by: TACoS over time
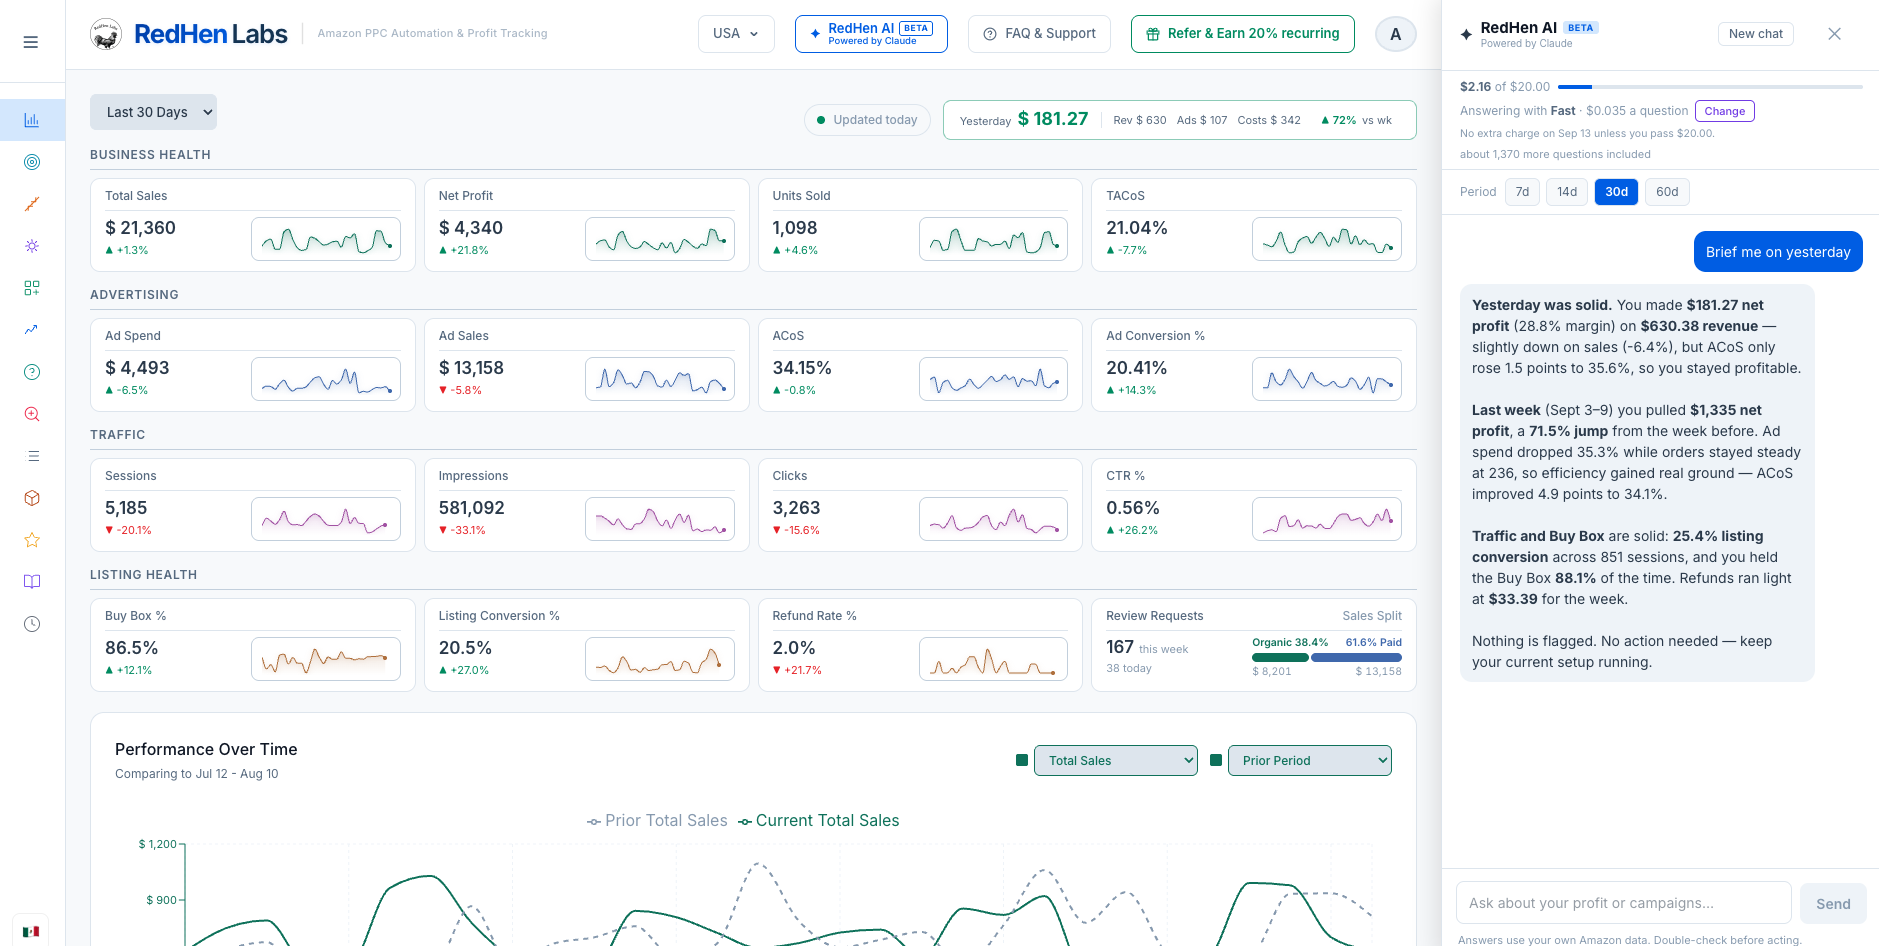
If ACoS isn't the master metric, what is? For me it's TACoS — ad spend against your total sales, organic and paid — watched as a trend, against real profit. We're here to make money, and TACoS over time is the closest single line to "are the ads building the business or just renting sales." When TACoS drifts down while sales hold, your ads are doing their real job: priming the organic flywheel so you don't pay for every order forever.
That's the number ACoS literally cannot compute, because it never sees your organic sales. It's why I wanted the total-sales picture in the first place — you can't judge whether advertising is working if you can only see the part of the business advertising gets credit for.
Why "the right ACoS" depends on your business — and your moment
Here's the part the benchmark crowd skips. If your customers come back — repeat purchases, subscriptions, a consumable they reorder — a high ACoS on the first sale can be exactly right. You're not buying a transaction, you're buying a customer, and their lifetime value pays back that first expensive order. You know your repeat rate; the tool's job is to hand you TACoS and real profit so you can run to it — not to pretend it knows your customers better than you do.
Sell one-shot items with no reorder, and it's the opposite — no second purchase to recoup an aggressive bid, so efficiency is survival.
Same dial. Different setting. And the setting changes with your moment, too.
The part we framed wrong: this tool runs both directions
I'll own something. We've mostly talked about this tool as a way to cut wasted ad spend. That's half of what it does, and the less interesting half.
During launches, I intentionally run ACoS above break-even — because I'm buying rank, reviews, and velocity, not this quarter's per-unit profit. The automation isn't there to suppress spend. It's there to identify winners faster and push harder when the data supports it. Defend your margin or invest for growth — same engine, opposite directions. You decide which.
What we built, and what we left out
A few decisions that explain the tool: we built the SP-API integration so you see total profit, not just ad metrics. We made TACoS over time the headline number. We run both a manual rules engine and an AI layer, because some decisions are mechanical and some need judgment a threshold can't make. And we kept the scope deliberately narrow — PPC management done well, not a bloated suite — which is how it stays simple enough for a normal seller and cheap enough to keep paying for. That focus is also why we don't have an LTV dashboard or a forty-metric analytics wall. We'd rather do the advertising decisions right than be a platform you open once and forget.
So, the honest takeaway — from someone who, yes, builds this tool; the bias is real and the math is also real, and you can run every bit of it in a spreadsheet if you'd rather. Stop optimizing a number you borrowed from someone else's business. Find your real break-even ACoS per SKU, watch TACoS over time against real profit, and point the dial at what you're actually trying to do this quarter — protect margin, or buy the market. See your real margins — free for 14 days.

.png) Partner
Partner