ACoS looks healthy but you're losing money on every sale. Here's the math most Amazon sellers skip and how real profit tracking changes everything.
If you manage Amazon PPC based on ACoS, you're optimizing against a metric that can't tell you whether you're actually making money. ACoS measures the ratio of ad spend to ad revenue. That's it. It has no visibility into your cost of goods, your FBA fees, your referral fees, your return rate, or any of the other costs that determine whether a sale is profitable. A "good" ACoS can easily be a losing one.
The number that lies to you every day
Here's a product most sellers would consider healthy:
- Selling price: $29.99
- ACoS: 22% ($6.60 ad spend per sale)
- Amazon referral fee (15%): $4.50
- FBA fulfillment fee: $5.80
- COGS (landed): $10.00
- Average return cost (8% rate): $0.90
Total cost per unit: $27.80. Revenue: $29.99. Actual profit: $2.19.
That's a 7.3% margin on a product with a "healthy" 22% ACoS. One small shift — a supplier price increase, a slightly higher return rate, a CPC bump during Q4 — and you're underwater. But your ACoS dashboard never warned you because it can't see any of those costs.
The break-even ACoS most sellers don't know
Every product has a break-even ACoS — the maximum ad-spend-to-revenue ratio at which you still make $0 profit. It's calculated from your actual margins, not from a benchmark or industry average. (We cover the full budget math in How Much Should You Spend on Amazon PPC?)
Using the numbers above: your pre-ad margin is $29.99 - $4.50 - $5.80 - $10.00 - $0.90 = $8.79 per unit. That $8.79 is the most you can spend on ads and still break even. As a percentage of revenue: $8.79 / $29.99 = 29.3%. That's your break-even ACoS.
Any ACoS below 29.3% is profitable. Any ACoS above it is losing money. But you can only calculate this number if you know your actual costs per product. If you don't track COGS, FBA fees, and returns at the product level, your break-even ACoS is a guess — and most sellers guess wrong on the optimistic side.
What changes when you track real profit
Sellers who switch from ACoS-only to margin-based optimization typically discover three things:
- Their "best" campaigns aren't. The campaigns with the lowest ACoS often advertise products with the thinnest margins. Low ACoS on a low-margin product can mean less actual profit than a high ACoS on a high-margin product.
- They've been under-spending on winners. Products with healthy margins can tolerate a higher ACoS than they thought. Raising bids on these campaigns increases volume without hurting profitability.
- Some products should never be advertised. When you see the real cost structure, some products simply don't have enough margin to sustain any ad spend. Shutting those campaigns down is the fastest path to profitability.
How to start tracking profit per product
At minimum, you need to know four numbers per product: COGS (landed cost including shipping to Amazon), FBA fulfillment fee, referral fee, and average return rate. With those four inputs, you can calculate your real margin and your break-even ACoS. Everything else — storage fees, PPC cost per unit, promos — makes the picture more accurate but those four get you 90% of the way.
The problem is that Amazon doesn't show you this in one place. Seller Central scatters these numbers across six different reports.
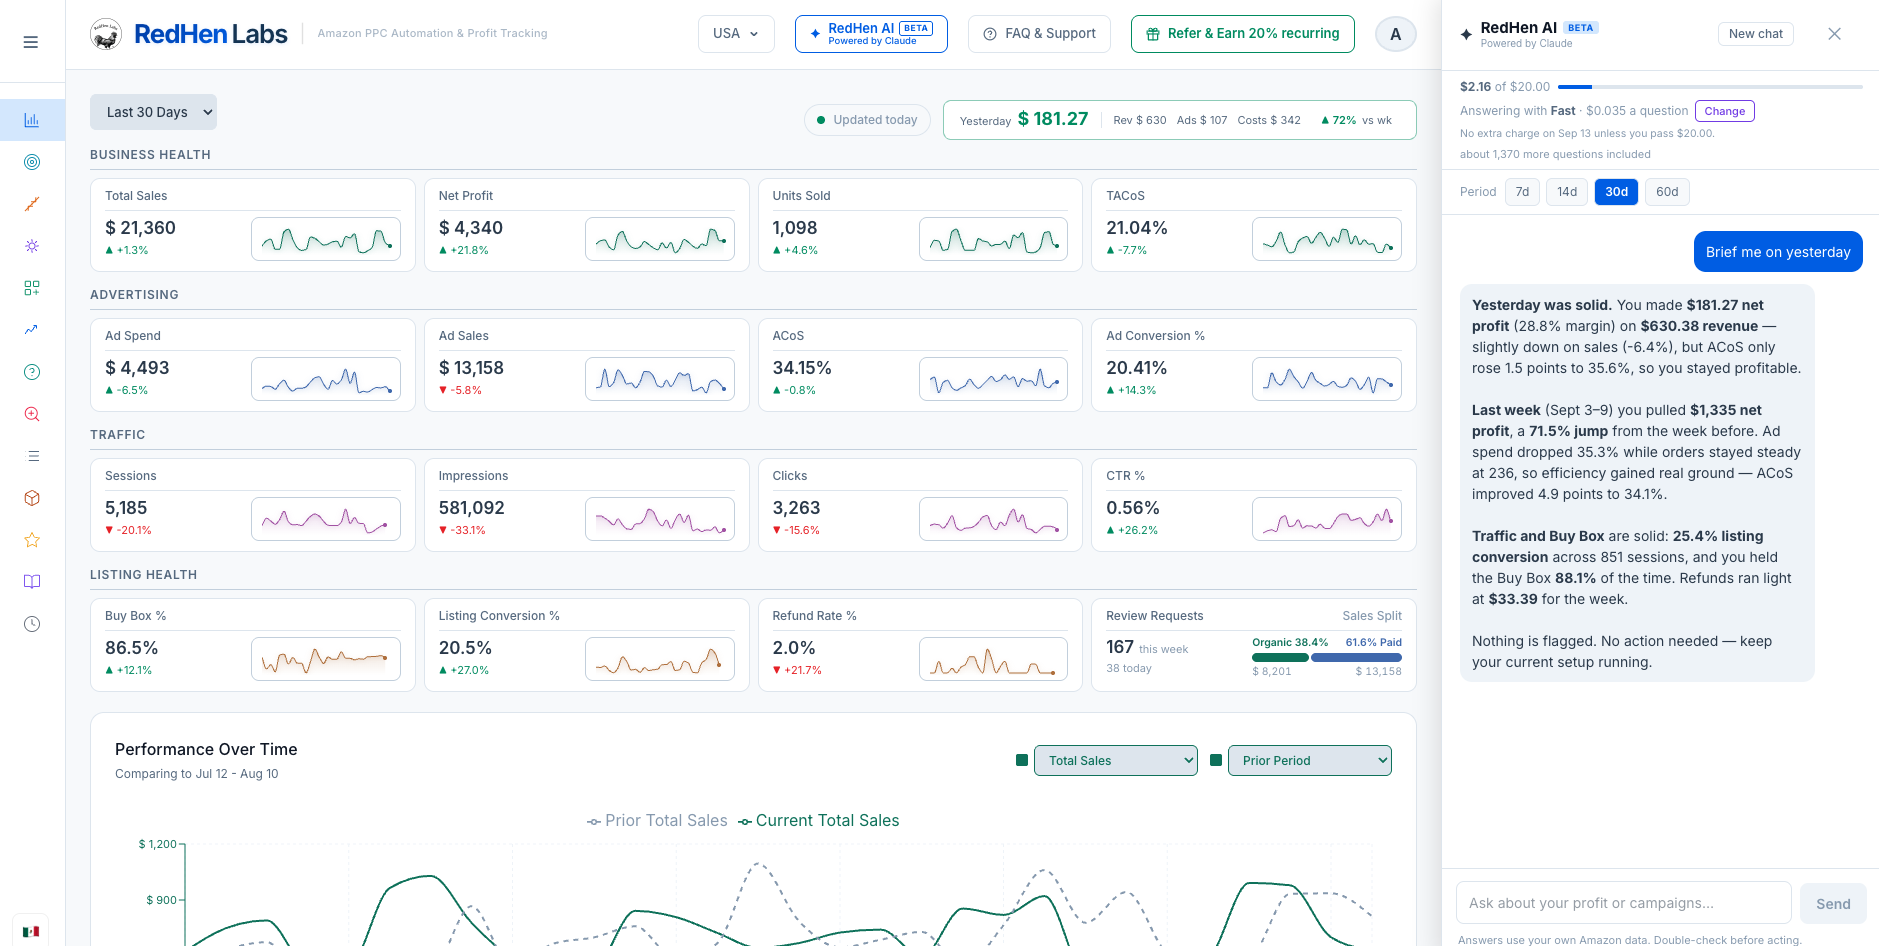
RedHen Labs pulls all of it together automatically — COGS, FBA fees, referral fees, ad spend, returns — and shows you real profit per product, per day, per campaign. Your break-even ACoS is calculated for every product so you always know your ceiling. See your real numbers — try it free for 14 days.
.png) Partner
Partner